Table of Contents
Ladder Diagrams
In addition to the textual explanation provided on the Results Page, most ECGs in the ECG Quiz include ladder diagrams. A ladder diagram is a visual tool used to represent the heart's electrical activity and can be helpful for describing rhythms observed in an ECG. Here are some benefits of using ladder diagrams
- Clarifies Conduction Pathways: Ladder diagrams visually depict the flow of electrical impulses through different parts of the heart (atria, AV node, and ventricles), making it easier to understand conduction patterns.
- Simplifies Complex Rhythms: They help break down and illustrate complex arrhythmias in a clear, step-by-step manner.
- Enhances Learning: Visual learners benefit from the diagrammatic representation, which complements textual explanations and deepens comprehension.
- Facilitates Diagnosis: By highlighting the relationships between P waves, QRS complexes, and conduction delays, ladder diagrams assist in diagnosing specific conduction abnormalities and arrhythmias.
Ladder diagrams are a valuable supplement to textual explanations, providing an intuitive and detailed perspective on rhythm interpretation.
Viewing Ladder Diagrams
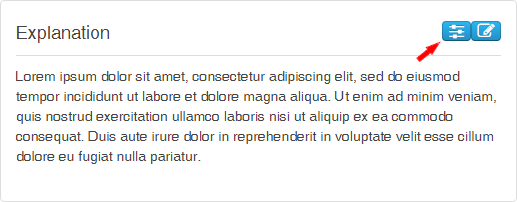
In the Explanation Section on the Results Page, the button will be enabled if a ladder diagram is available for the ECG.
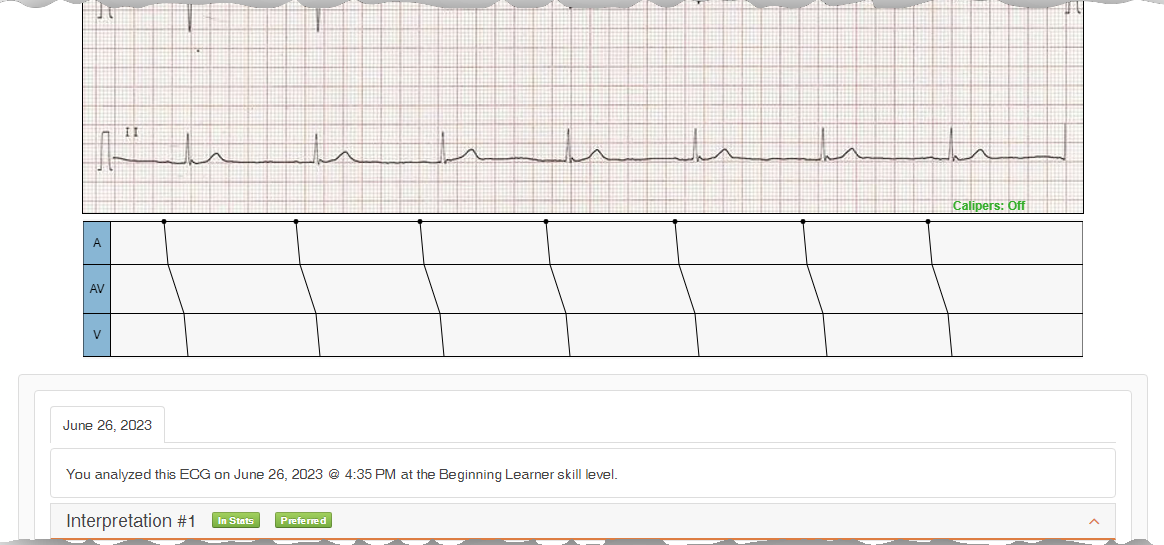
Clicking the button toggles the display of the ladder diagram. The ladder diagram appears between the ECG tracing and the results, as shown in Fig. 2.
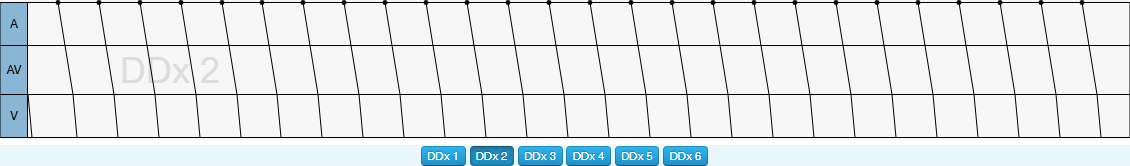
Multiple Ladder Diagrams
ECGs with differential diagnoses often include multiple ladder diagrams, each explaining a specific diagnosis in the differential. In these cases, two or more buttons will appear below the ladder diagram window, indicating that multiple ladder diagrams are available. Clicking on these buttons allows users to view and analyze the different ladder diagrams, providing insights into each potential diagnosis. This feature enhances the understanding of the ECG by offering detailed visual explanations for all plausible interpretations.