Table of Contents
The Results Page
The Results Page presents our grading of your analysis of the ECG. The Results Page contains these four sections, which are described below.
The ECG Display Section
The top of the results page presents the ECG that you just analyzed. This section describes the interface for each ECG type available in the ECG Quiz.
Short Telemetry ECGs
Figure 1 shows the interface for 6-second and 10-second short telemetry ECGs. The buttons on the toolbar above the ECG are described on the Short Telemetry ECG Toolbar page.

Long Telemetry ECGs
Figure 3 shows the interface for 30-second and 60-second long telemetry ECGs. The buttons on the toolbar above the ECG are described on the Long Telemetry ECG Toolbar page.

Data-Based 12-Lead ECGs
Figure 2 shows the interface for data-based 12-lead ECGs. The buttons on the toolbar above the ECG are described on the Data-Based 12-Lead ECG Toolbar page.

Image-Based 12-Lead ECGs
Figure 4 shows the interface for Image-Based 12-Lead ECGs. The buttons on the toolbar above the ECG are described on the Image-Based 12-Lead ECG Toolbar page.

The Results Section
The Results Section contains these three regions, each of which are described below:
The Tab Region
Figure 6 illustrates an example of the Tab Section. At the top, you'll see one or more tabs, each representing the results from each time you encountered this ECG. For instance, if you interpreted this ECG twice, there will be two tabs visible in this section.
The difficulty of the ECG is shown in the upper right corner of the Tab Region. The difficulties include  ,
,  , and
, and 
The date and time of your ECG interpretation are displayed below the tabs, along with the skill level at which your interpretation was evaluated.
The Interpretation Region
The Interpretation Region contains our assessment of your interpretation of this ECG. The section is composed of these four subregions:
Your Interpretation
This region contains the diagnoses you selected for this ECG. The icons to the left of the diagnosis indicate if we assess the diagnosis as a True Positive or a False Negative. Refer to the Icon Key Section for a key to the icons.
Correct Interpretation
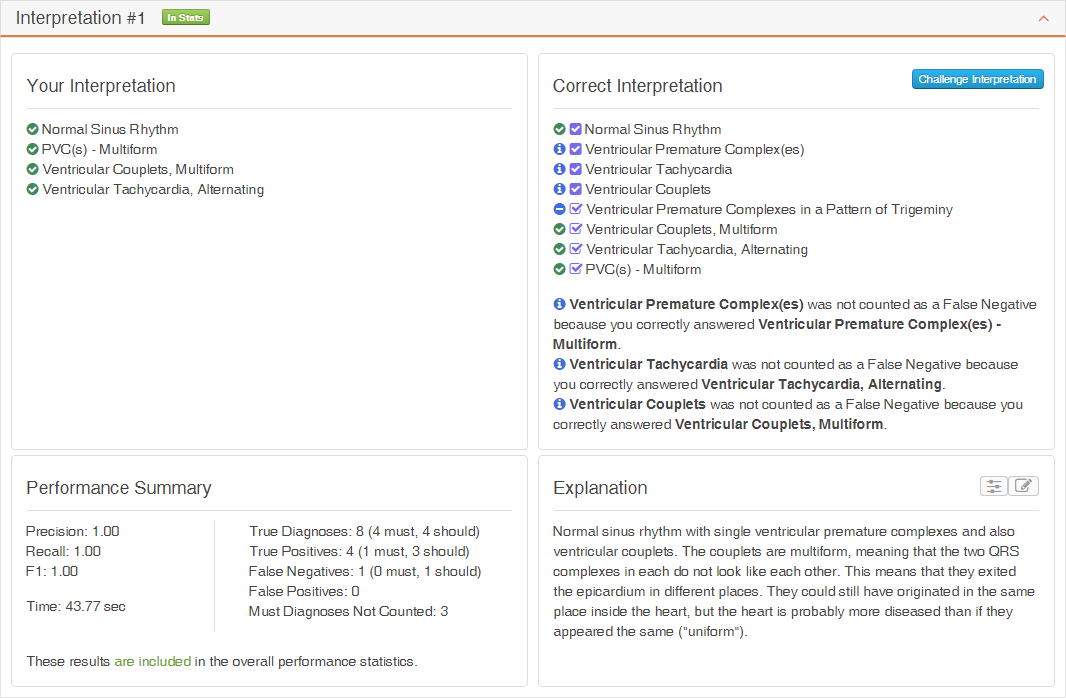
This region contains the true interpretation of this ECG. The icons to the left of the diagnoses indicate if the true diagnosis is a True Positive, a False Negative, a missed Must diagnosis, or a diagnosis that was not counted. If diagnoses that are not counted are present, an explanation as to why the diagnosis was not counted is presented. Refer to the Icon Key Section for a key to the icons.
If you disagree with our interpretation of this ECG, you can challenge our interpretation by clicking on the ![]() button to initiate a challenge to let us know what you think the interpretation of this ECG should be.
button to initiate a challenge to let us know what you think the interpretation of this ECG should be.
Performance Summary
This region contains the numeric result of our assessment of your interpretation of this ECG, including the amount of time you took to analyze the ECG.
If this interpretation is included in your overall statistics, a statement to that effect will be present at the bottom of this section. In addition, the  icon will appear in the title bar of this interpretation.
Explanation
This region contains the explanation we provide for this interpretation of this ECG. If a ladder diagram is available, the ladder diagram icon will be active. Click on this icon to toggle the display of the ladder diagram. If annotations are available, the annotations icon will be active. Click on this icon to toggle the display of annotations that will appear in the ECG display.
Single Interpretation Example
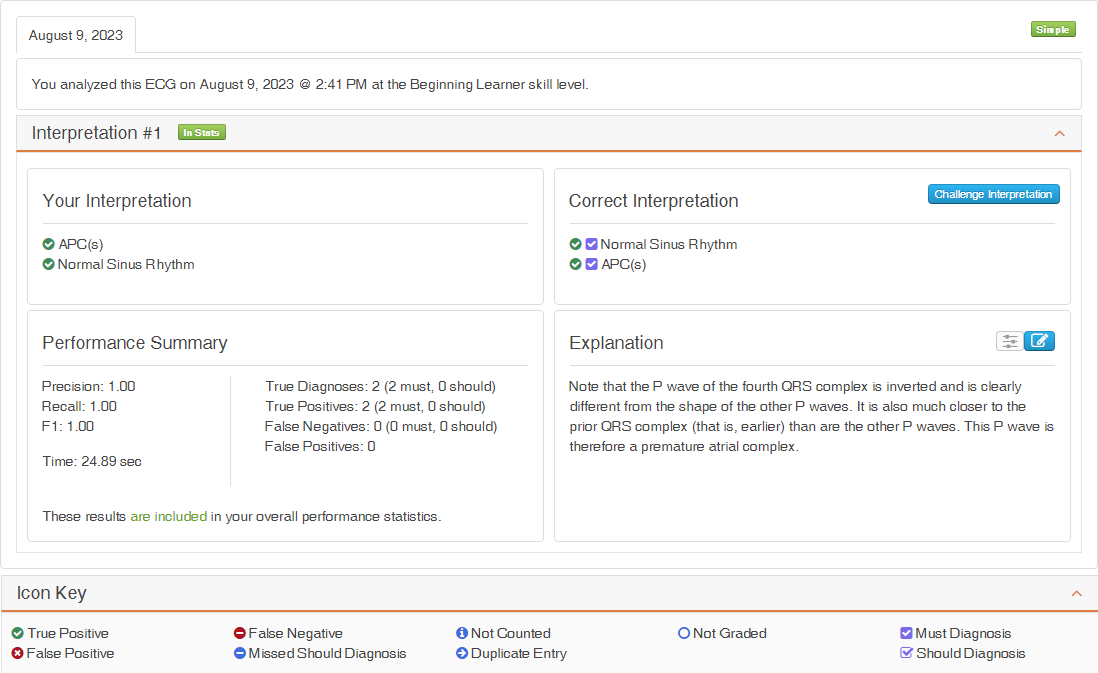
If you are viewing your performance for an ECG that has a single interpretation defined for it, the Interpretation Section will contain a single interpretation, as shown in Figure 7.
Multiple Interpretation Example
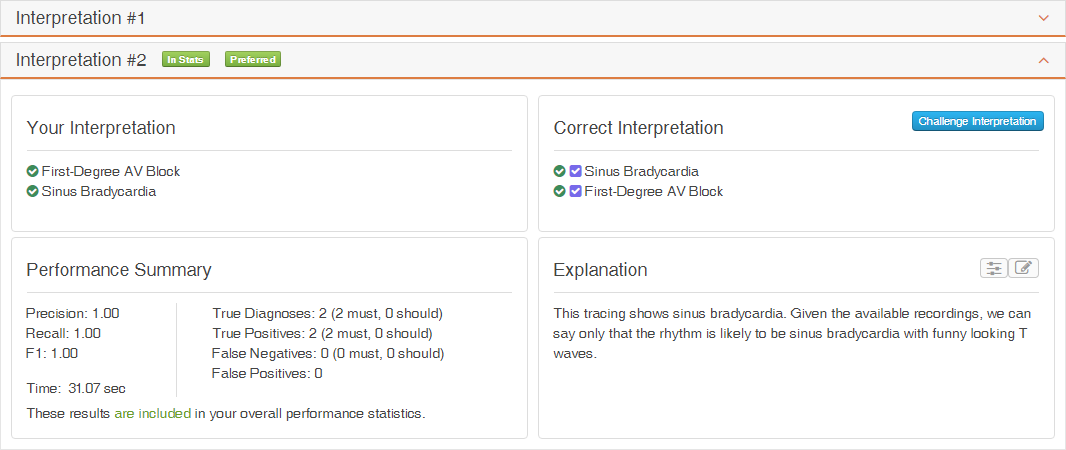
The ECG Quiz allows for more than one interpretation to be defined for an ECG. If the ECG has more than one interpretation, we will present our assessment of your interpretation against all interpretations available for the ECG. In these cases, the Interpretation Section will contain multiple interpretation sections, as shown in Figure 8.
To toggle the display of an interpretation, click on the title bar for that interpretation. For the example shown in Figure 8, if you want to view Interpretation #1, simply click on the title bar for Interpretation #1. Clicking on the title bar for Interpretation #2 will close the results for that interpretation.
When an ECG has multiple interpretations, we mark one of the interpretations as the preferred interpretation. The title bar of the preferred interpretation will contain the  tag, as shown for Interpretation #2 in Figure 8.
Icon Key Region
The Icon Key Region shown in Figure 9 provides the key for the bullets contained in the “Your Interpretation” and the “Correct Interpretation” sections of the Results Section. See the The Scoring Algorithm and Understanding the Results for definitions of the items in the key.
The Ratings Section
This section displays how other ECG Quiz users rated this ECG. An example of the Ratings Section is shown in Figure 10. The available ratings are:
- Sample Quality
- Rate how clear the sample is visually, from 1 being difficult to see to 5 being excellent.
- Difficulty
- Rate how difficult you found this sample to be to interpret, from 1 being easy to 5 being difficult.
- Satisfaction
- Rate your overall satisfaction with this sample, from 1 with no satisfaction to 5 being totally satisfied.
If you have not provided a rating for this ECG, you can do so by clicking on the star that best represents your rating.
The Comment Section
The ECG Quiz allows users to comment on each ECG a user interprets. The comments entered for an ECG are shown in this section. In Figure 11, no comments have been entered. If comments had been entered for this ECG, they would appear in place of the “Be the first to comment” statement.
To add a comment to this ECG, click on the “Post a comment” button.
You can also subscribe to receive comments entered by other users to this ECG via email by clicking on the “Subscribe” link.
Multiple options are available for sorting the comments. You can change how the comments are sorted by clicking on the “Newest First” dropdown list and selecting one of the entries on the list.
Multiple options are available for presenting the comments. You can change how the comments are presented by clicking on the “Nested” dropdown list and selecting one of the entries on the list.


